Teens talk on learning and tech

student panel 2

Just a few days ago, I was fortunate to participate in the Archdiocese of Philadelphia Summer Tech Academy for Secondary Teachers.  There was a great deal of collaboration among my colleagues and many interesting topics that we discussed. However, the biggest learning, for me at least, took place during a student panel discussion.

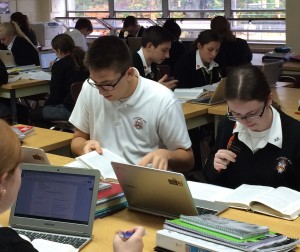
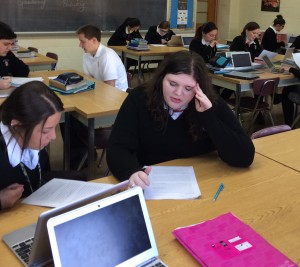
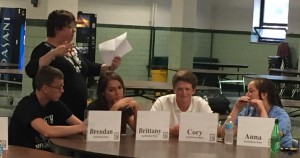
Four students from Conwell-Egan and four of my students–Anna, Brendan, Brittany, and Cory–fielded questions from high school teachers across the archdiocese about their digital lives.   They were open, honest, and full of information.Some of the most compelling information revealed interesting points about cell phones, social media, cheating, and the way they like to receive information from their teachers.

Cell phones, they claim, can be both a distraction and a learning tool.  Each school has different rules about cell phones.  Some schools, like Conwell-Egan, require students to place their phones in the perimeter of the class, out of reach.  Ryan allows students to keep their cell phones on them, but turned off.  Both sets of students report being distracted from learning when they see their cell phones vibrate, and they say it is hard to concentrate on learning when they are worried that their parents or friends are trying to contact them.

On the other hand, they report that they can do everything on their cell phones, including writing papers and reading books.  Many of them would like to be able to keep their cell phones on their desks, but several did agree that it could invite kids to multi-task to the point of distraction.  

They seemed to agree, however, that being able to check their phones regularly, like at change of class and at lunch, would remove the worry about not being connected and allow them to focus on class better.

Are they addicted to their phones? They did not answer this question head on, but they did try to explain that their cell phones contain everything that matters–socially and academically.  

Social media is woven into their lives via their cell phones.  Many of them tweet their friends–but they use twitter very differently than adults.  Socially, they use it to create a version of themselves to share with their fellow teens.  They are careful what they write, but they will use Twitter, sometimes, to carry on a disagreement or to call someone out on something hurtful.  In that regard, they may “subtweet”–writing a tweet without using the person’s handle (@xxxx).  The recipient of the message will know who it is intended to reach, and so will people who are aware of the situation.

They do not use hashtags.  They see hashtags as pretentious and/or as a sign of not knowing how to use Twitter.  

Although it seems that most of their Twitter use is social, some of it can provide very effective academic support.  The Conwell-Egan students reported finding a Twitter page that helped them prepare for an AP test, and they all agreed that if their teachers would create pages on Twitter with relevant content that they would be very likely to use that.

The students reported that they tend to migrate away from social media platforms where adults predominate, like Facebook. And although there are many adults who use Twitter, it seems to me that they have created a different way to use Twitter than the adults.  Many of the kids use Instagram as their main tool, along with Snapchat.  And they intimated that once more adults take over those platforms, they will likely leave them as well.

Bullying and fighting is alive and well in the teenage digital world.  As is cheating. But the teens were clear to tell us that these negative sides always have existed, whether digital or old school.  There have always been teens who abused social conventions to hurt others or to cheat in school.  They seemed to want us to realize that cheating through screenshots or texts is really no different than teens years ago who passed pieces of papers in the hallways.

Teens, they said, will always push the envelope.  It was amazing to hear the students tell us that this is what teens do.  There will always be teens who do not do the right thing, and just because it is in a digital realm does not make it different.  They said that it is a function of maturity.  How mature of them to realize the psychology of adolescence and be able to tell us that their digital world is susceptible to that as well.

They also told is that they prefer to receive information about school via their cell phones.  They are less likely to check email or GradeConnect, but more likely to set their phones for notifications from a teacher’s tweet or from a teacher’s post in Remind–a free app that allows teachers, students, and parents to send and receive messages across devices.

The upshot of this panel discussion, for me at least, is that the students want us to meet them where they are–nothing new, but a constant reminder of our responsibility as educators to find ways to leverage the digital world to better teach and reach our students.

Above all, they said, they appreciate the efforts of teachers to try to reach them in ways that make sense to them. And they expressed the willingness to teach us all we want to know about the digital world they inhabit.

We asked.  They answered.  Now we need to hear them.  


student panel


Photos (top to bottom) courtesy of James Meredith and William Brannick
My 2016 classroom tech props and flops

My grades are submitted, and the full days of classes are over.  A few more days and my summer vacation begins in earnest.  Wrapping up the year certainly invites reflection.  Here are some of my successes and failures from this year’s technology integration.

REMIND: Props to that great program! This allows teachers to connect to their students through texting without anyone knowing other people’s cell phone numbers.  You can have your messages delivered to your cell phone or pick them up online.  For my cell phone oriented students, this was a great way for me to contact them with announcements or updates.

However, that made my integration of TWITTER more of a flop.  Students did not engage on Twitter as much as in previous years.  I use Twitter for posting original content or retweeting pertinent ideas.  However, I also used it in the past to get messages to my students.  Remind replaced that function.  

Also, I found out that my students do not use #hashtags.  That was a rude awakening for me because #Ilikemakingpointsinhastags.  They read my tweets, but they rarely replied or retweeted. Few students this year leveraged the power of Twitter for their own PLN.  Part of that was due to the Internet connectivity issues we endured since March, but this is something I need to set as a goal for next year! #bringbacktwitterTuesdays

NEWSELA: Props to my administration for investing in that program.  However, the delay with the PA state budget prevented us with getting this up and runflopsning until the second semester when the time seemed to slip through our fingers.  So that’s a flop, too.  However, it is definitely a goal for next year to get all teachers inserviced on this program. My principal has a great idea for using this as part of our PSAT/ SAT student preparation, and I am excited for that.

KAHOOT: Props to this engaging and fun way to get kids involved.  But I flopped with this because I never even used it until last week.  Tsk tsk.  Goal for next year–more Kahoot sooner!

PIKTOCHART: A great tool for my students to use for creating infographics, this program definitely deserves props.  Kids used it in AP for goal setting in the beginning of the year and several times in Digital Literacy.  I want to use more infographics next year, and having been inspired by Kelly Gallagher, I will attempt to redefine the way I teach Digital Literacy by having more smaller projects before the big one.  

HAIKU DECK: Props to this beautiful app.  I love Haiku Deck.  The kids love it.  Even though it seems like a simple tool, something for younger children perhaps, this app let me bring home the power of visuals and less text.  Props to those students who got closer to understanding that less is more for a visual presentation and that their oral presentation is better when it is conversational.  Definitely need to work on helping more kids understand that.

Interestingly enough, I realized that when I create presentations, my level of confidence is inversely proportionate to the number of words I put on a slide.  The more words, the less confident I am.  Is that a prop or a flop?

EDUCREATIONS: Props, props, and more props.  Here is an opportunity to help students practice their oral presentation skills.  Again, our Internet issues impacted the second semester students from working in depth with this, but this is a definite keeper in the classroom.

GOOGLE CLASSROOM: Props to infinity and beyond! As a previous Schoology and Edmodo user, and a former Ning aficionado, I initially thought Classroom was somewhat thin in what it would allow me to do with my students.  I was wrong.  I love it.  Okay you have to use Drive with it, but I love Drive, too.  I can give assignments, collect assignments, post work, assign conversations, personalize the page and many more things. The only bad part is it is hinkey when you assign work but forget to “give each student a copy”.  I would like to see that made easier than having to delete and recreate the assignment, but that really is my fault (flop again)  for being too eager pressing enter.  

IPADS: I did not use them much at all this year, and when I did it was often problematic with the sign ins for my students.  I love iPads, but only as single user devices.  That’s a prop for sure.  But sharing iPads is more difficult for my students who use technology every single day.  If I only had a cart of iPads, I would use them every day, but I would prefer each student to have his/her own.

CHROMEBOOKS: PROPS, PROPS, PROPS.  This is my second year with a cart of Chromebooks.  These have gone through multiple students every day for two years straight, and I only had ONE key come loose on one device. They are fast, they are clean, and they are effective.  In a perfect world, every classroom teacher would have a cart of Chromebooks.  That would provide a 1:1 environment without the kids losing, breaking, or forgetting their own device.

Overall, it was a very good year as far as technology in my classroom. What are your thoughts about your tech use this year? I would love to hear from you.


Info on infographics

I love infographics.

There was a time, not that long ago, that only graphic designers could create infographics.  Now, with free programs like Piktochart, anyone can create an infographic.

Some people believe that infographics are geared toward relaying data, but others believe that infographics can be used to display data as well as to quickly relay information.  I like this infographic on infographics (is that a meta-infographic?)

In Digital Literacy, we teach our students how to read infographics and how to create them.  Students need to examine different types of infographics in order to understand the variety of ways that they can be used to provide information. And there is an explosion of infographics to study! They are used in many online resources, and compared to the ones that we used to see in texts and other print materials, they are increasingly engaging.

The ability to catch a reader’s attention, especially online, when there are so many other things to explore, is a blog infogrpahicskey skill in developing effective infographics.  Here are some amazing examples.

Thirteen reasons why your brain craves infographics

What happens after you drink a Coke

African elephants need our help

A global carbon footprint

How empathy can improve your life

My infographic explaining the Digital Literacy course

As you can see, there IS data in most of these examples, but there are many other components including the careful use of text, color, and graphics.

My digital literacy students create infographics for a Pro-Con argument.  They research a topic and categorize reasons on both sides of an issue before presenting their conclusion.  The skills they practice include close reading, paraphrasing, summarizing, research, citation, fair use and creative commons, creating an argument, as well as exploring the aesthetics of color, typography, and graphics.

How could you use infographics?

For any project that requires explanation.  Certainly with math and any statistics project.  For process analysis.  For cause and effect.  For lab results.  For a timeline.  

Not only are infographics everywhere you look, but now people can even create a resume with infographics.

I think a good place to begin is by trying to create one yourself.  Check out Piktochart.  Follow them on Twitter and Facebook.  Subscribe to their blog. They offer great guidance and helpful tips.  Enter their contests.  I won an Amazon gift card and free pro accounts for a whole class!

Creating infographics is a great way to engage your students and provide them with up to date and real world digital experience with conveying information.


When technology fails, make lemonade

When technology fails, we are often left to scramble for alternatives.  

When technology fails in a technology class, well, that really causes a scramble.

Some connectivity issues in my school have forced me to rethink activities for my digital literacy class.  And much to my surprise, I was forced to really think about the SAMR model.

The SAMR model reflects the use of technology for substitution, augmentation, modification or redefinition.  My interpretation of that model is that “redefinition” is where a class like digital literacy should reside.

But I learned that even without technology, I was able to help my students work at a much higher level, “redefining” the way they could work to organize and categorize ideas for a Pro Con topic to be presented in an infographic.

Where I usually offer choice in the Pro Con project, I chose instead to work on one topic for the class because of the constraints caused by the connectivity issue.  Even though choice is key in my opinion for student engagement, I was lucky to come across a topic that instantly interested my students–is a college education worth the cost?

First, we discussed some information about the cost of college.  Recently, twitter exploded with posts about the cost of one year at NYU–$71,000.  I offered that information to my students, and explained the differences between community colleges, state colleges, and private colleges.  I touched upon some statistics about the average earnings of a college graduate, and I offered them some personal anecdotes.  After answering questions and clarifying some points, I asked them to complete a Collins Type 1 writing about whether college was worth the cost.

They pair-shared their answers, and we sampled the class.  We voted on who was of the opinion that college is worth the cost and who was of the opinion that it wasn’t.  We posted the results on the board.

They were hooked.

Even though I could not give them a choice, they were interested, activated, and engaged.

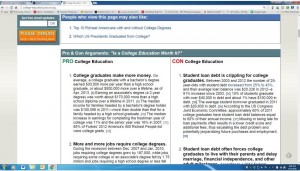
The next part, gathering information, was easy.  Even though I am a devotee of all things on our school database. I really like ProCon.org.  And I really like how the site offers a list of Pro Con points with detailed facts.

But my kids have a hard time digesting this much information on their own, and with 17 points for Pro and 17 for Con I was nervous about getting started.

That is when I remembered that even high school kids like manipulatives.

In digitablog pro con sitel literacy class, I more often offer a digital organizer, but nothing makes work easier than 17 slips cut up and ready to be moved around.

I copied the MAIN sentence of each point P1, P2 or C1, C2 and so on.  WIth a little help from some of my wonderful students–Taylor and Jackie, especially–we cut up all seventeen PROS and all seventeen CONS and put each set in different envelopes so each group in each class would get one envelop of PROS and one envelop of CONS.

I directed my digital literacy students to empty the envelop with the PROS onto their table, and as a GROUP, move the papers around blog listand organize them into groups that made sense.

They made QUICK work of this.  This was much faster–and more effective–than when they do this digitally.

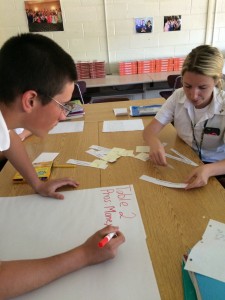
I then asked them to find ONE word that categorized each pile.  They put that word on a post-it and clipped the pile together.

They transferred their category words and the corresponding codes that matched the word onto giant post its and put it on the board.  

Then the bell rang.

So this is where I plan to go this week. We will do a gallery walk of the six groups of each classlemonade tech and look at the category words.  Each student will have a CHOICE.  I will ask them to choose three different categories and whatever codes they think will work well from the ones their classmates organized.

Then they will have THREE major points and a place to go for all the supporting details they need (the original list.)  Then we will work on paraphrasing the essential facts.

Repeat with the CONS.

From there, they will be asked to form a personal opinion on the points they have chosen and voila!  All the information they need to put together an infographic will be at their fingertips.  

Certainly, designing an infographic on Piktochart.com is an example of the redefinition indicated in the SAMR model.  But in this case, the gathering and organizing of their information was “redefined.”

All because technology failed.